By Cadenus
On this page
Most social media report templates are a design file: pretty slides, empty charts, and an hour of manual work every month. This one is a working spreadsheet: you paste your numbers into one tab, and the Report tab builds itself: month-over-month deltas computed, the best post picked automatically, a 12-month trend chart that grows as you use it. Then you export it as a PDF and send. Free, no account; it works in Google Sheets and Excel.
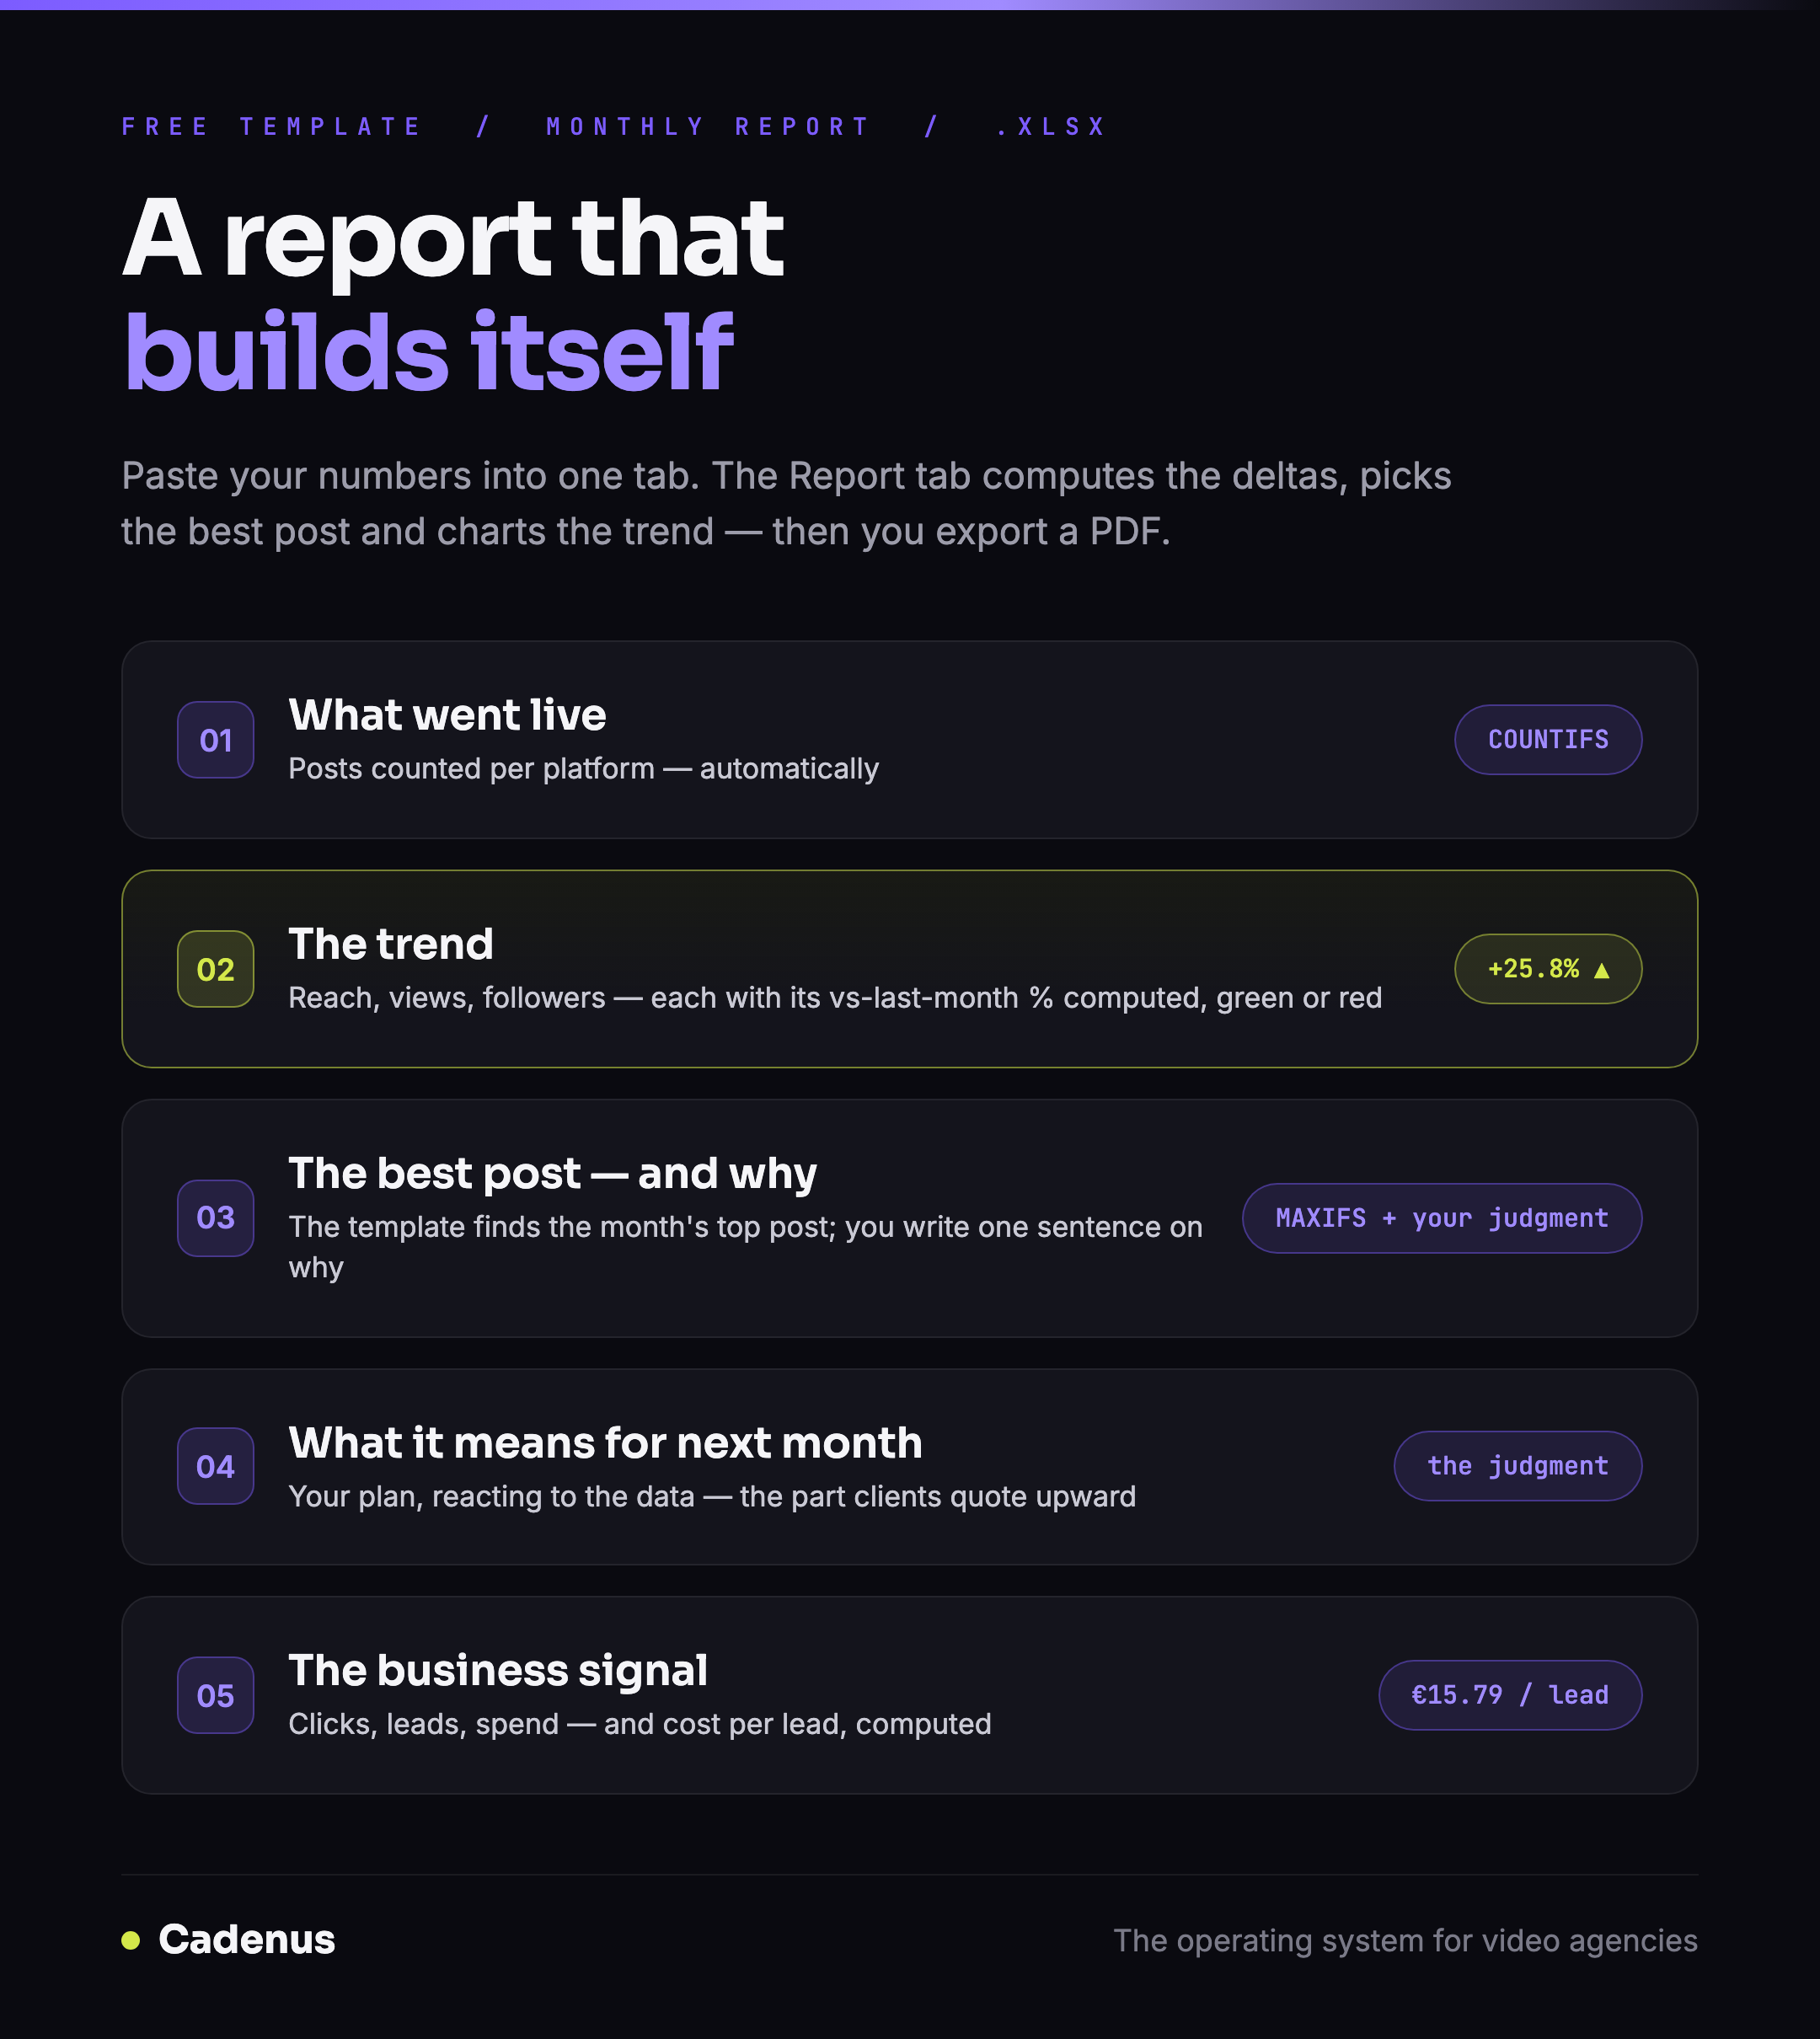 The Cadenus social media report template: a data entry tab that feeds a self-computing, client-ready monthly report
What's inside the template
- Report: the page you send. A KPI band with automatic vs-last-month percentages, a 12-month reach and views chart, and the five sections clients actually read.
- Data entry: ten minutes a month: one metrics grid (followers, reach, views, engagements, clicks, leads, spend), one row per post, and three judgment notes.
- Settings: your agency, the client, your month labels and platforms. Every dropdown follows these lists.
- Start here: the two-minute orientation.
The file comes pre-filled with a sample month, so you see the finished report the moment you open it, then replace the sample with your numbers.
Why it is shaped this way
We wrote a full guide on what belongs in a social media client report, and the finding behind it is blunt: long reports get skimmed. What gets read, and repeated to the client's boss, is five things:
- What went live: proof of work, counted per platform automatically.
- The trend: reach, views, followers and engagement, each with its vs-last-month delta computed for you, green or red.
- The best post and why: the template finds the month's top post by views; you write one sentence on why it worked. That sentence is the most-quoted line in the report.
- What it means for next month: your plan, reacting to the data.
- The business signal: link clicks, leads, spend and an automatic cost per lead. The section almost no agency includes, and the one that renews contracts.
The template is those five sections and nothing else. One page, exportable to PDF, readable in ninety seconds.
The monthly routine
- Open Data entry, fill this month's column in the metrics grid.
- Add the month's posts, one row each, with views.
- Write the three notes: why the best post worked, the plan, the business signal.
- Open Report, pick the month from the dropdown, and read it once as your client would.
- File → Download / Save as PDF → send.
Ten minutes, and the math never argues back, the deltas, the totals and the cost per lead are formulas, not typing.
When the spreadsheet stops being enough
The template does the arithmetic, but the copy-paste is still yours: every platform, every month, by hand. That is the part that stops scaling somewhere around the fifth client. Cadenus builds this same report from live data, publishing and performance flow in from the connected accounts, and reports go out white-label, under your agency's name. The template teaches the shape; the product removes the labor.
FAQ
What should a social media report include?
Five things: what was published (per platform), the key metrics with a comparison to last month, the best-performing post with a reason why, the plan for next month, and the business results, clicks, leads and cost per lead. This template computes the numbers and leaves the judgment to you.
Does the template work in Google Sheets?
Yes. Upload the .xlsx to Google Drive and open it, it converts automatically, with the dropdowns, formulas and chart intact. It also works in Excel 2019 or newer.
How do I send the report to a client?
Open the Report tab, pick the month, then export just that tab as a PDF (File → Download → PDF in Google Sheets, or Save As → PDF in Excel). The page is print-formatted, so it lands as a clean one-pager.
Is the report template really free?
Yes, we email you the file, that's the whole exchange. No account, no trial. It's the same five-section structure Cadenus uses for its automated white-label reports, as a spreadsheet.
How is this different from other report templates?
Most templates are a layout you fill in by hand. This one computes: month-over-month percentages, per-platform post counts, the best post of the month and cost per lead are formulas, and the 12-month trend chart updates itself as data accumulates.
Sources
- The thinking behind the structure: Social media client reporting, the guide
- Plan the month before you report it: the content calendar template