Blog
What 11,861 business Reels show about what actually performs on Instagram
A study of 11,861 Instagram Reels from 130 businesses: humor and collaborations showed up more in hits, while posting time, hashtags and length did not.
Cadenus · 23 September 2026 · 14 min read
Most advice about Instagram Reels gets repeated so often that it starts to sound like data: post at the right hour, keep it short, add hashtags, put a face in the first frame, invest in production. Digital Influence, a Romanian social media agency, tested that advice against 11,861 Reels published by 130 businesses between January and June 2026, about 255 million views in total.
The answer is less comfortable than a checklist. None of the features chosen in advance as the main hypotheses passed every check. What did show up repeatedly was humor, and collaborations with accounts that bring an audience of their own. Posting more often did not raise the odds for each Reel, but it gave an account more chances to reach its next breakout. Posting time, caption and hashtags produced no difference in views that repeated across the sample.
This is a summary for agencies and social media managers. The full study, in Romanian, has the methodology, the charts, the sector breakdowns and every number for both halves of the sample. At the end, we show how to run the same comparison on your own niche, by asking an AI agent connected to Cadenus.
The short version
- There is no guaranteed recipe. More than 20 features were tested. None of the ones chosen in advance as primary hypotheses passed every check: a face in the first frame, on-screen text in the opening, a question in the hook, the format, the length, when the speaking starts, a professional look.
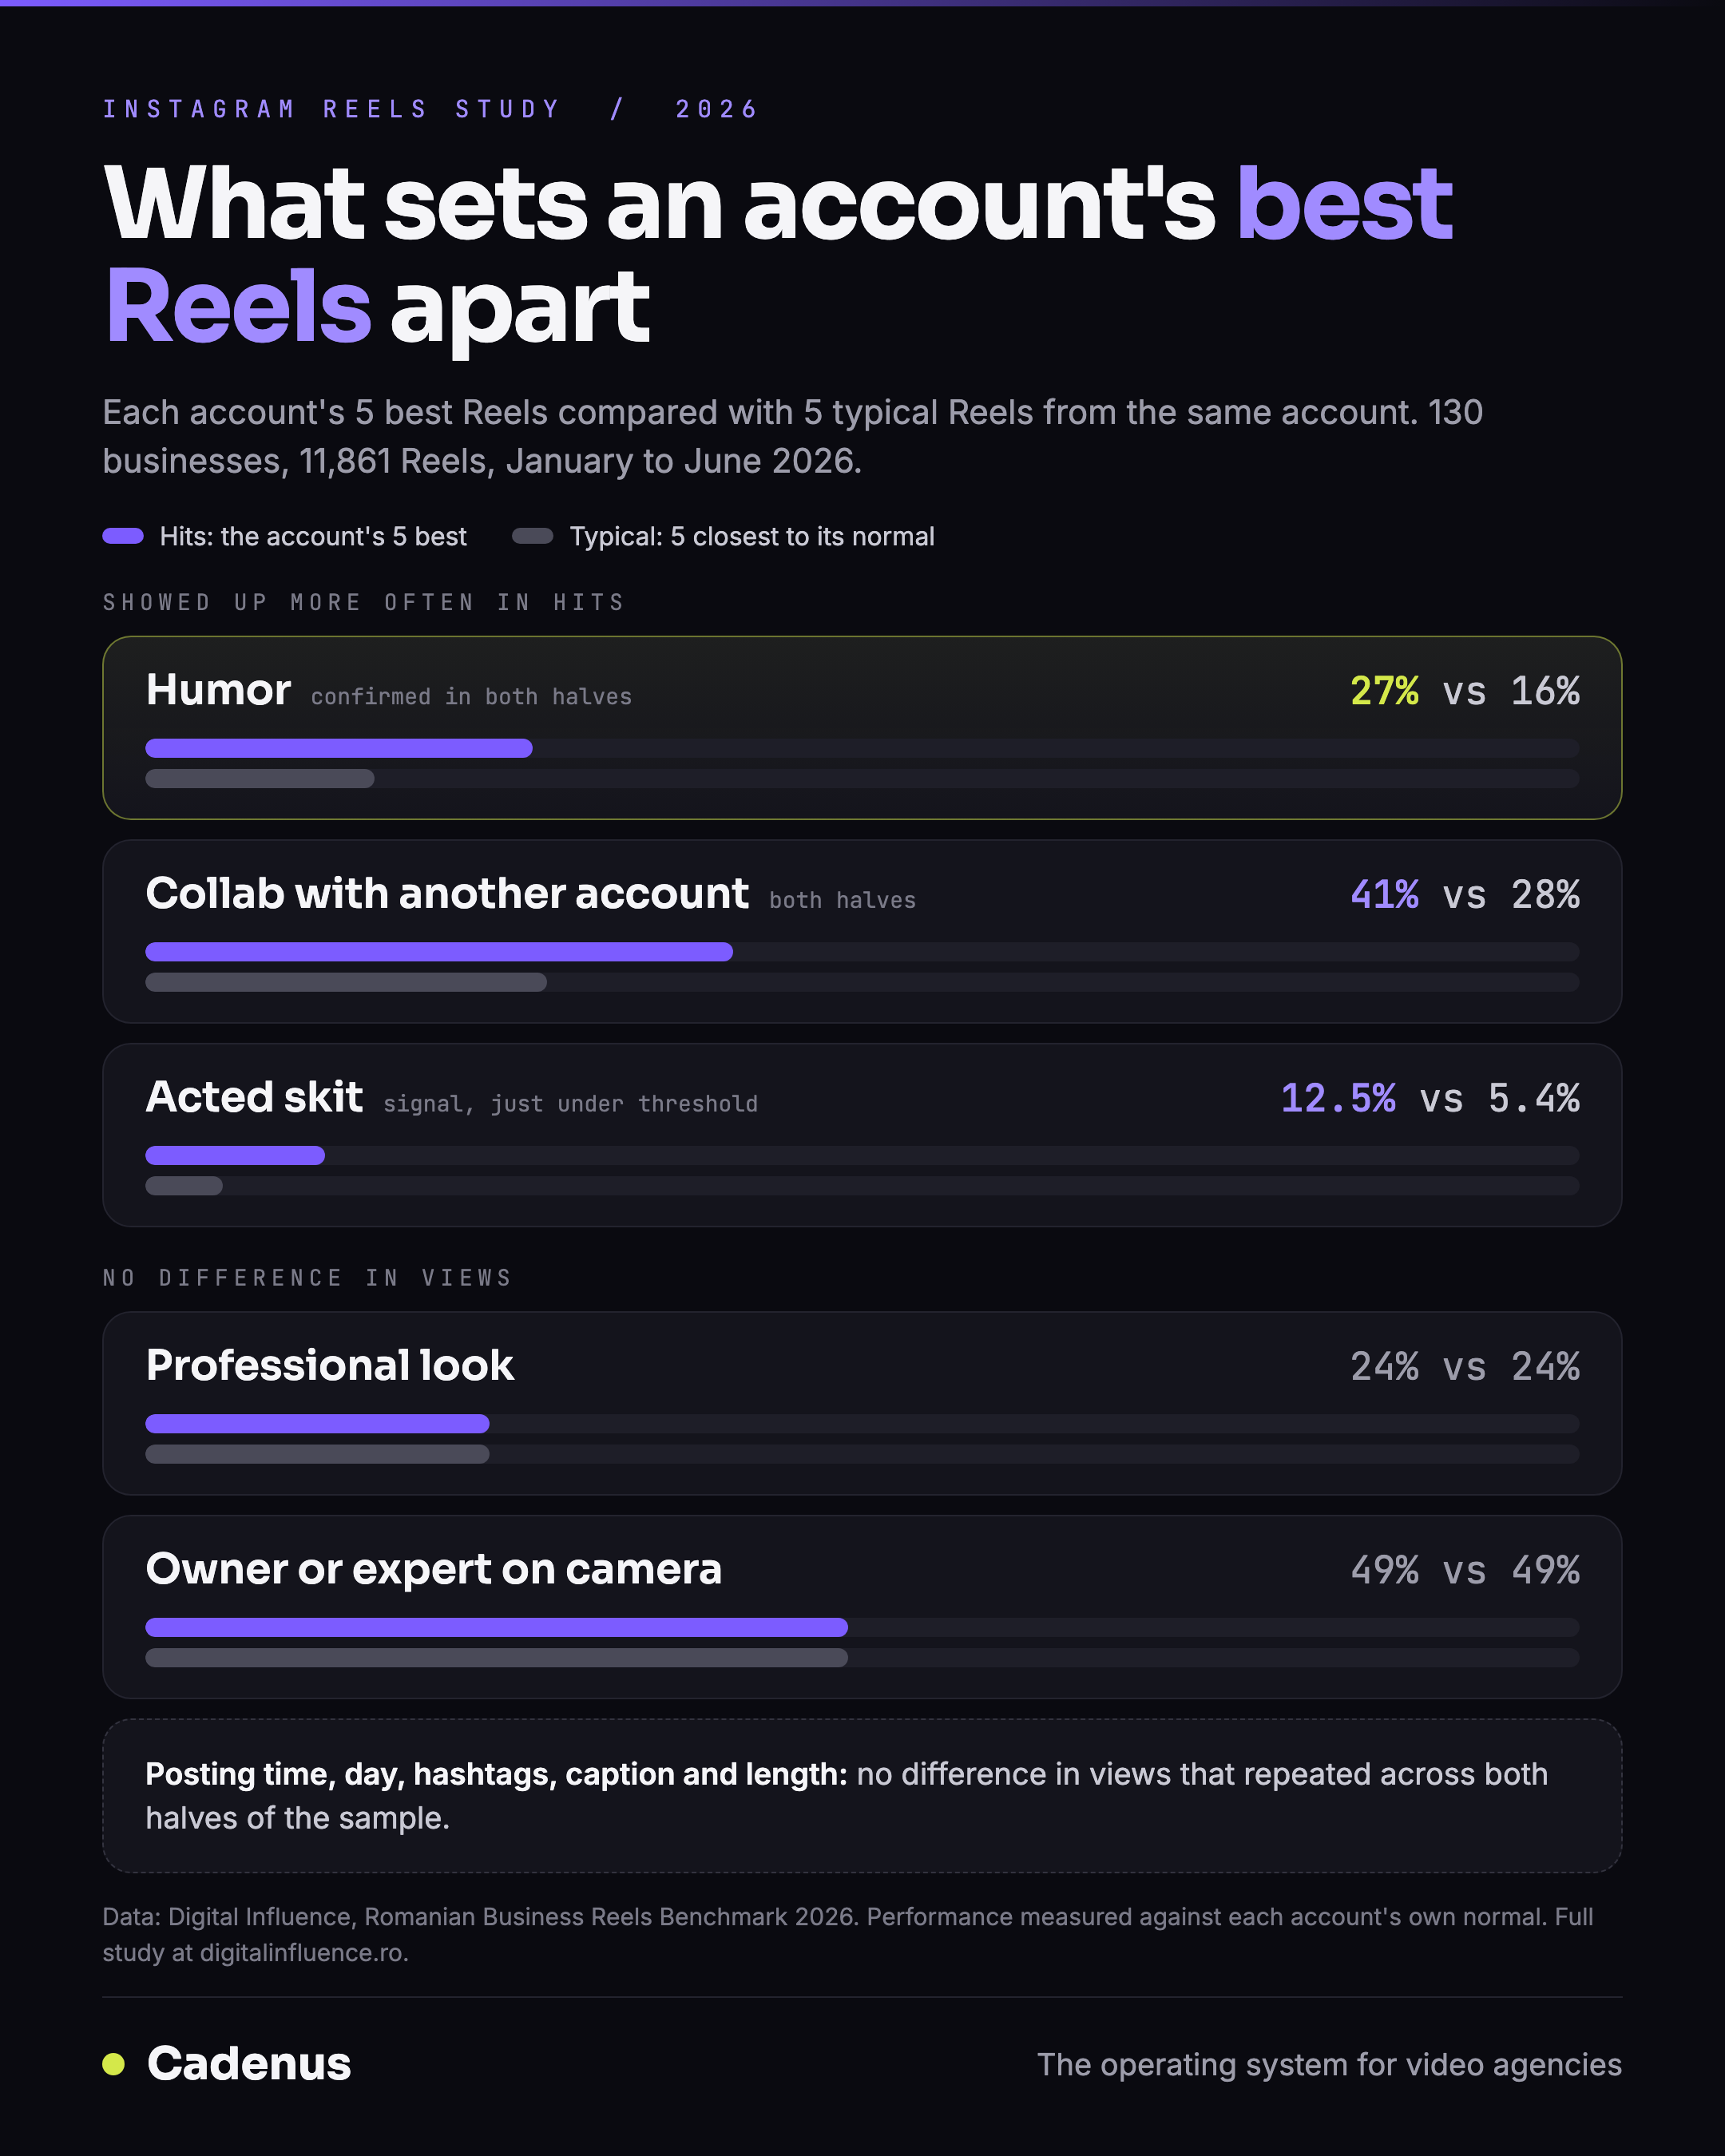
- Funny Reels stand out. Humor appears in 27% of an account's hits and 16% of its typical Reels, in both halves of the study, and a human checked the coding.
- Collaborations travel further when the partner has an audience. Reels co-published with another account are 41% of hits and 19% of weak Reels. Collaborations with an account of similar size had about twice the views of the account's other Reels.
- The idea matters more than the timing. The same video, reposted on another day with a new caption, performed about the same as the first time.
- A professional look does not separate hits from typical Reels by views. Polished-looking Reels are 24% of hits and 24% of typical Reels. Its effect on trust or sales was not measured.
- Hits come from volume. 1 Reel in 29 reaches at least 10 times the account's normal. At five or six Reels a week, that is roughly one every five weeks.
- Selling lowers likes, and “comment X” raises comments, not views.
How the study measured performance
Comparing raw views across accounts mostly measures account size. A Reel with 20,000 views is a hit for an account whose Reels usually get 2,000, and a miss for one that usually gets 80,000.
So the study compared every Reel only with its own account. The account's normal is the median views of its Reels published within 45 days before and after, excluding the Reel itself. A Reel at 1× performed like a typical Reel of that account; a Reel at 10× had ten times the views of a typical one.
That is the same score Cadenus uses to rank videos: how far a video outperformed its own account's baseline, rather than whether it crossed a fixed view count. The study refined it with the 45-day window, which corrects for older Reels having had more time to collect views and for accounts growing or shrinking over six months.
From each account, 15 Reels were coded: the five with the highest score (the hits), the five closest to the account's normal (typical) and the five with the lowest score (weak). That gave 1,944 coded Reels. An AI model described what could be seen and heard in each one, from frames, the transcript and the caption, without ever knowing how many views a Reel had or which group it belonged to. A human reviewer then checked the key features blind, including humor on 120 Reels and every Reel coded as a skit.
Two further rules keep the results honest:
- The account is the unit of analysis. Each business counts once, however many Reels it posts.
- A result had to repeat. The accounts were split at random into two halves of 64 and 66. A primary finding needed a difference of at least 8 percentage points in the first half, then had to repeat in the second. The hypotheses, the thresholds and the tests were fixed and dated before the analysis.
What shows up more often in hits
Humor
Funny Reels were 27% of hits, 16% of typical Reels and 10% of weak ones. The gap was 12.2 points in the first half and 10.7 in the second, and it held when the largest retailers, the most extreme Reels and trend-based content were taken out. The human reviewer agreed with the AI coding in 86% of cases (kappa 0.71). After correcting for the Reels where the model saw humor and the person did not, funny Reels were still about twice as common among hits: roughly 21% against 11%.
Humor was on the exploratory list, not among the primary hypotheses, so the study reports it as an exploratory finding that was confirmed. It is still the most solid result in the data.
Skits
A skit is a scene acted out: characters, dialogue, a small story. Skits were 12.5% of hits, 5.4% of typical Reels and 2.5% of weak ones, and every one of them was checked by a human. The difference against typical Reels was 7.2 points in one half and 7.0 in the other, just under the 8-point threshold, so the study treats skits as a strong, consistent signal rather than a proven rule.
The kind of skit mattered. Scenes about life inside the business, such as a customer with an odd request or what staff think when a customer walks in, and parodies of viral formats appeared 46 times among hits and 3 times among weak Reels. Skits that end with the product solving the problem looked more like ads, and appeared about as often among weak Reels as among hits. The numbers are small, so treat this as a direction.
Collaborations
Reels published jointly with another account through Instagram's Collab feature were 41% of hits, 28% of typical Reels and 19% of weak ones, in both halves and in all five sectors. Part of it is mechanical: a Collab appears on two profiles, in front of two audiences.
Who you collaborate with changes the result. The typical partner had about a third of the business's followers: employees, customers, small creators. Those collaborations performed close to the account's other Reels, at 1.07× and 1.2× in the two halves. Collaborations with a partner of similar size had about twice the views, and partners two to ten times larger went higher still, at 1.8× and 3.7×.
Filmed outside, a guest, a trend format
Three more patterns pointed the same way in both halves without passing the threshold in both: filmed at least partly outdoors (25% of hits, 16% of typical Reels), a guest in the video (16% against 9%) and a recognizable trend format (18% against 11%). Like humor and collaborations, all three break the account's usual routine.
What weak Reels have in common
Turned around, the comparison describes the Reel that does not move: images cut to music with nobody speaking, nothing funny, published on the business's own profile only, often with a direct offer.
- Music-only montages were 24% of weak Reels and 13% of typical ones, in both halves. The human and AI coders agreed on this feature less often than the threshold required (kappa 0.49), so it is reported as a signal.
- Direct commercial intent was in 61% of weak Reels and 52% of typical ones.
- Direct sales content also got about a quarter fewer likes per view than the account's other Reels.
The advice that did not hold up
These are the tips the study checked directly. A tip counted as confirmed only if the difference appeared in both halves, on different accounts.
- The perfect posting time. No hour and no day beat the account's normal in both halves. The deviations were at most 14% and did not repeat.
- Hashtags. Zero, one to three, or four to ten hashtags: no repeatable difference.
- Shorter is better. Within the same account, the link between length and views was practically zero. Reels under 10 seconds sat slightly above normal, not enough to rule out chance, and Reels over 90 seconds were not penalized.
- Invest in production. A professional look appeared in 24% of hits and 24% of typical Reels. It did not separate Reels by views, whatever it does for the brand.
- Put a face in the first frame. It showed up in the first half of the study and disappeared in the second.
- Open with a question. A question in the first three seconds was in 19% of hits and 25% of typical Reels.
- Add subtitles. 82% of hits and 82% of typical Reels already have them. They no longer set anyone apart.
- Start speaking in the first second. 94% of Reels with a voice already do, and hits do not do it more often.
- The owner should be on camera. The owner or expert appears in 49% of hits and 49% of typical Reels.
- “Comment X to get Y” boosts reach. Among the 11 accounts that used it at least three times, comments went up at 9. Views did not: 1.06× on average, and higher at only 6 of the 11.
- The blue check brings reach. Verified accounts get more views because they have more followers. Relative to followers, they reach 27% against 25% for the rest.
The same video, posted twice
The cleanest test of timing came from the accounts themselves. 23 accounts republished the same video, a median of 44 days apart. That gave 122 pairs where the content was identical and only the day, the hour and the caption changed.
- An original that was a hit, at least 2× normal, came back as a repost at a median of 3.1× normal. An original below normal came back at 0.7×.
- The performance of the original and the repost moved together, with a correlation of 0.77, or 0.68 without the account that reposted most.
- The caption was changed on 106 of the 122 reposts. Reposts with a new caption beat the original about as rarely as those with the same caption: 40% against 38%.
A large part of the difference between an account's Reels seems to come from the video itself, not from when it goes out.
Hits are a volume game
- 1 Reel in 5 reaches at least 2× the account's normal.
- 1 in 15 reaches at least 5×.
- 1 in 29 reaches at least 10×. Those 406 Reels, published by 94 of the 130 accounts, account for 30% of all the views in the study.
Views are concentrated. The best 10% of an account's Reels bring, at the median, 45% of its views. Smaller accounts reach 10× slightly more often than larger ones: 4.1% of Reels for the smallest third, 3.5% for the middle, 3.0% for the largest. A breakout is not a privilege of big accounts.
The study found no link between how often an account posts and the chance that a given Reel reaches 10×: 4.0% for accounts that post rarely, 3.1% in the middle, 3.4% for frequent posters. Posting more does not dilute the Reels, it reaches a hit sooner. Accounts posting a median of 5.6 Reels a week got a 10× Reel about every 5 weeks; at 2.5 a week, about every 13 weeks; at 1.3 a week, about every 20. This compares different accounts, so it shows a link, not a rule.
What this means for agencies
For an agency running several client accounts, most of this changes how results are read, not only what gets made.
- Report against each client's own normal. A client's Reel is a hit at 2× that account's baseline, not when it crosses a view count borrowed from another account. It also keeps month-to-month reports comparable while the account grows.
- Judge a strategy on 10 to 15 Reels, not one. A weak Reel does not prove a bad idea, and a hit is not guaranteed to repeat. At two or three Reels a week, a single month is too short to call.
- Spend the effort on the idea, not the slot. The day, the hour, the caption and the hashtags did not produce differences in views that repeated. Schedule at the team's convenience, which does not cost reach either, and put the time into the concept.
- Leave room for humor, even for serious clients. Not in every Reel, but consistently.
- Try one skit a month. Start from a scene the client's customers would recognize, and keep the product in the background, not in the punchline.
- Plan collaborations with accounts at least the client's size. A supplier, a partner business, a well-known customer, a local creator with an audience.
- Cut back on music-only montages and constant selling. Keep “comment X” for leads and private conversations, not for reach.
Find the top performers in your niche with your AI agent
The method does not need 130 accounts to be useful. Its core, comparing each video with its own account's normal, works just as well on the ten accounts that matter to one client.
Connect your AI agent to your Cadenus account and it can do that research for you in conversation. Claude, ChatGPT, Claude Code and Codex all connect through the Cadenus MCP server, and the agent works with the same data you see in the app.
- Look up any public account. Name a competitor, a creator or a local business, and the agent finds its TikTok, Instagram and YouTube profiles.
- Rank its videos against its own normal. The agent pulls the account's top videos, ranked by how far each one beat that account's median views. It is the same logic the study used, so a 5× Reel from a small local business shows up next to a 5× Reel from a large brand instead of being buried by it.
- Check the accounts you already watch. The accounts on your watchlist are scanned every day, and the agent can list every video above the threshold you set, such as 3× or 5× normal, for one platform or all of them.
- Send an idea into production. Once an idea is saved, the agent can turn it into a production item that carries its script, ready for the team.
In practice, you ask for it the way you would ask a colleague:
Look up the Instagram accounts of these five dental clinics and list the Reels that reached at least 5× their own account's normal, with links.
Which Instagram videos from the accounts we watch are at least 5× their account's normal?
Then open the links and read them the way the study did. Is the top of the list full of humor, skits and collaborations? Which accounts keep posting music-only montages that never move? The agent finds and ranks; deciding what fits the client stays with your team.
Setup takes a few minutes, and the developer guide covers each AI client. Looking up new accounts needs write access. Creator research is included from the Starter plan up and in the free trial. Start a free trial and ask your agent what works in your niche.
What the study cannot tell you
The study is explicit about its limits, and they are worth repeating:
- Association, not cause. It shows what appears more often in hits, not what produces them. A business might film a skit precisely when it has a good idea.
- A specific population. The accounts were chosen on purpose: Romanian businesses active on Reels, with roughly 1,500 to 250,000 followers, in five sectors (beauty and wellness, education and personal brands, retail and e-commerce, local services, professional services).
- Paid reach cannot be separated. Instagram does not mark promoted Reels publicly, so public view counts can include paid distribution. The within-account comparison still holds, because every Reel is compared with the same account's other Reels.
- Views, not watch time. Public data shows views, not how much of a Reel was watched. Length may matter for retention in ways this data cannot see.
- Small effects can hide. 130 accounts reveal medium and large effects. An effect of a few percent could go unnoticed.
Read the full study
The full report, Instagram Reels pentru afaceri: ce arată 11.861 de videoclipuri din România (Romanian Business Reels Benchmark 2026), is published by Digital Influence, in Romanian. It includes:
- the charts behind every finding;
- a breakdown for each of the five sectors, plus national retail chains compared with smaller retailers;
- the types of skits and how each performed;
- the full methodology, the reliability of the coding, the robustness tests and every deviation from the original plan;
- the results for both halves of the sample, with 95% confidence intervals.
Read the Instagram Reels study on digitalinfluence.ro
Digital Influence is the agency whose day-to-day client work Cadenus grew out of. We wrote separately about how it runs content production, approvals and reporting.
FAQ
Does posting time matter for Instagram Reels?
In this study, no. Across 11,861 Reels from 130 businesses, no hour and no day performed above the account's normal in both halves of the sample, and the deviations were at most 14%. When the same video was reposted on another day, it performed about as well as the original.
Do hashtags help Instagram Reels get more views?
Not in a way the study could repeat. Reels with zero, one to three, or four to ten hashtags performed the same relative to their own account's normal.
How often does a business Reel go viral?
It depends on the definition. Measured against the account's own normal, 1 Reel in 5 reached at least twice the typical views and 1 in 29 reached at least ten times. At five or six Reels a week, that is roughly one 10× Reel every five weeks.
Can an AI agent find top-performing Reels in my niche?
Yes, if it is connected to a tool that measures performance per account. Connected to Cadenus, an agent such as Claude or ChatGPT can look up public TikTok, Instagram and YouTube accounts by name and rank their videos by how far each one beat that account's own median views, the same comparison the study used.
What kind of Reels performed best for businesses?
Humor appeared in 27% of an account's hits against 16% of its typical Reels, and collaborations with another account in 41% against 28%. Acted skits appeared 2.3 times more often among hits, just under the study's threshold. A professional look made no difference to views.